RL Post-Training: Co-Operative Time-Slicing with llm-d


In Reinforcement Learning (RL) post-training for Large Language Models using algorithms like GRPO, optimizing the ratio of generator (sampler) to trainer throughput is the single largest driver of infrastructure Total Cost of Ownership (TCO). Because typical RL post-training loops alternate sequentially between generation and optimization phases, GPU and TPU clusters sit completely idle for 40% to 60% of their lifecycle.
Today, llm-d introduces a new well-lit path for Co-operative Time-Slicing: the Snapshot Agent. Rather than forcing physical hardware to wait on upstream phases or sit idle during blocking operations, this platform-level capability dynamically interleaves independent RL jobs onto shared hardware blocks, driving aggregate accelerator duty cycles from the 40% baseline up to 70%+ efficiency without altering underlying model convergence or accuracy.
Key Takeaways
- Near Zero Idle Accelerators: Co-operative time-slicing multiplexes concurrent RL jobs onto shared GPU and TPU hardware, reclaiming stranded compute capacity and boosting duty cycles from ~40% up to 70%+.
- No Model Degradation: Because active jobs retain exclusive access to physical accelerators during their compute windows, there is no loss in token generation throughput or training step convergence.
- Low Code Changes: A lightweight two-call client API (
acquireandyield) integrates seamlessly into existing RL loops, while the Snapshot Agent automatically handles CUDA context evacuation and restoration to host DRAM under the hood.
The Core Efficiency Problem with RL Loops
Distributed RL post-training is a fragmented "stop-and-wait" loop. The pipeline operates as a cycle between generation and optimization. While generation is running, optimization accelerators sit idle and vice versa.
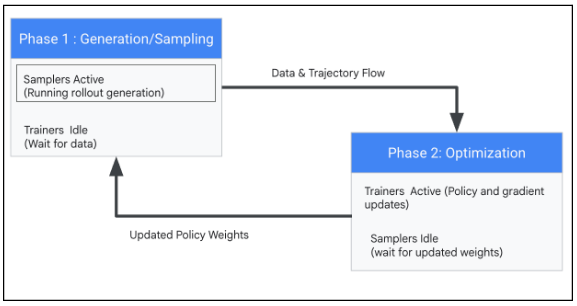
Traditional cloud infrastructure is designed for continuous, steady-state workloads. This alternating architecture introduces two systemic inefficiencies at scale:
- The Idle Accelerators: Because these phases occur sequentially, expensive GPU and TPU clusters sit completely idle (0% utilization) for 40% to 60% of their lifecycle. Trainers sit idle waiting for sampling rollouts to finish; samplers sit idle during gradient updates and weight distribution. This deadtime represents millions in wasted capital annually.
- The Context is Locked-In: RL trainers and samplers hold their accelerator allocations for the entirety of their runtime even during idle phases because the CUDA context and all device memory remain resident. Standard schedulers treat these pods as static, siloed allocations rather than aligning to the alternating, phase-level states of the live RL loop.
Introducing Co-operative Time-Slicing (RL Job Interleaving)
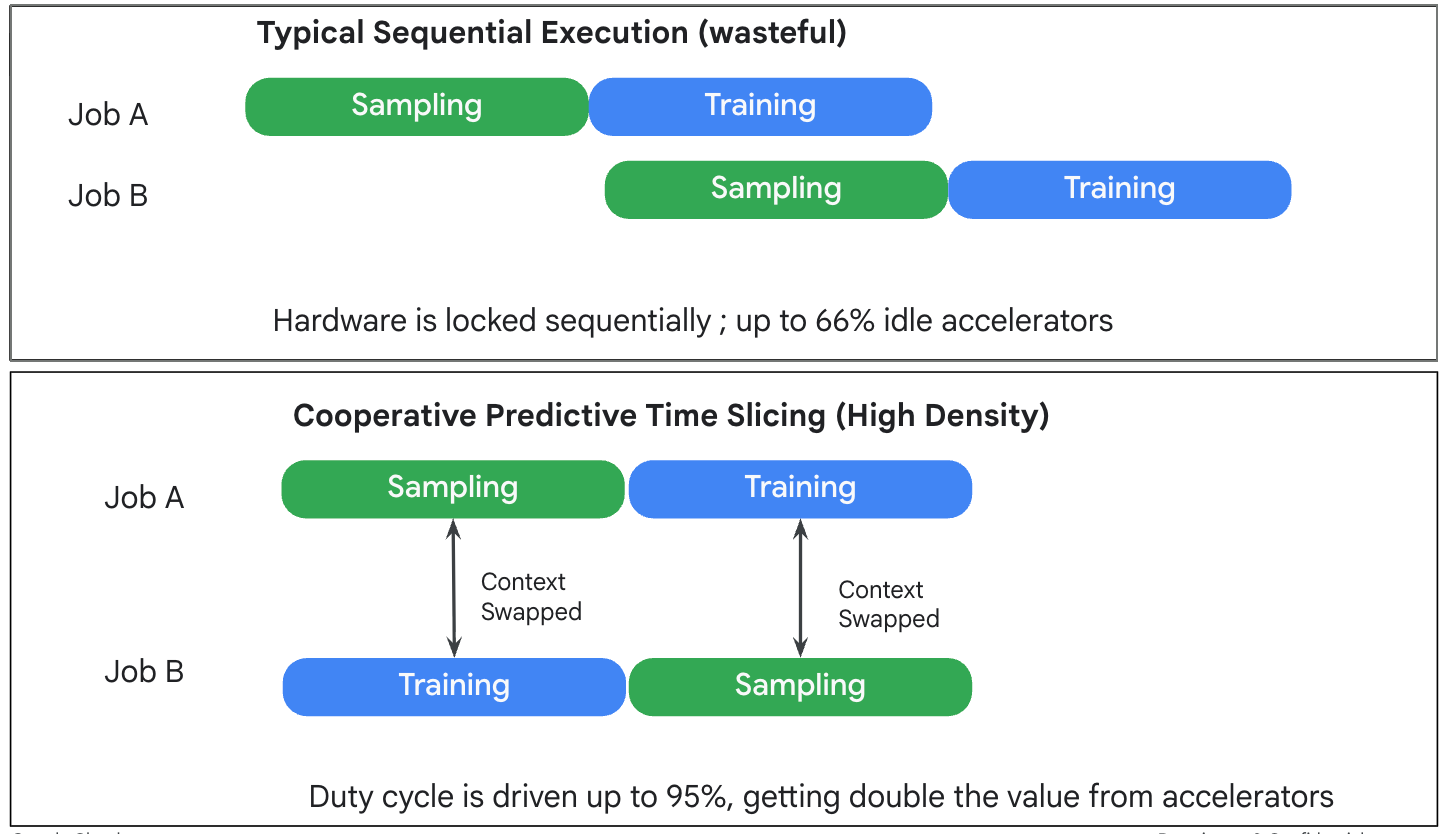
To eliminate idle accelerators during RL jobs, the llm-d project introduces Co-operative Time-Slicing. Rather than forcing hardware to wait on upstream phases, the infrastructure dynamically interleaves independent RL jobs onto shared hardware blocks, driving aggregate accelerator duty cycles up to 70% without altering the underlying model convergence or accuracy.
When Job A pauses its training phase to run reward evaluation on the CPU or distribute updated weights, the infrastructure time-slices the physical accelerators, swapping in the active sampling or training phase of Job B.
High Level Architecture Overview
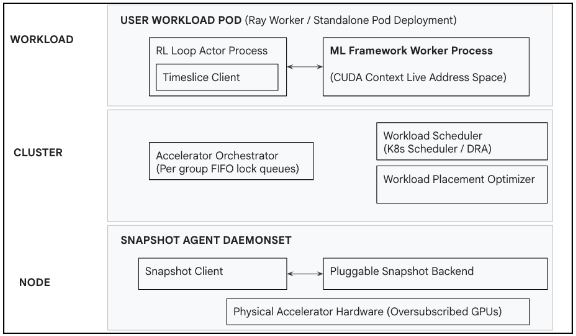
The Accelerator Time-Slicing Platform architecture is divided into three distinct operational boundaries—Workload-scoped, Cluster-scoped, and Node-scoped—to isolate developer code, cluster coordination, and physical hardware management. This layout maps how user-space runtime requests are translated into cluster-level lock queues and executed as node-level process context swaps.
1. Workload-Scoped Layer (Application Runtime)
This top layer encapsulates the containerized user training environment, such as a dedicated RayCluster or standalone Kubernetes pod configuration. It isolates the modeling code from infrastructure complexity:
- RL Loop Actor Process: The central coordinator of the training loop. RL code imports the TimeSlice Client, which explicitly signals phase boundaries to the control plane using simple
acquire()andyield()functions. - ML Framework Worker Process: The background compute worker running the core training stack (e.g., PyTorch, vLLM). It maintains the live CUDA context, model weights, and allocations inside its virtual memory address space.
2. Cluster-Scoped Layer (Control & Orchestration Plane)
This middle layer governs cluster-wide state, scheduling policies, and queue coordination across multi-tenant workloads:
- Workload Scheduler: Native Kubernetes scheduling infrastructure configured with Dynamic Resource Allocation (DRA). It uses custom DeviceClass parameters to enforce device oversubscription, instructing the cluster that it is safe to co-schedule multiple trainer/sampler pods onto the same physical hardware footprint.
- Accelerator Orchestrator: The central coordination engine of the platform. It dynamically discovers group topology based on user-defined labels, maintains FIFO lock queues per group to coordinate access to the accelerators, and fans out atomic snapshot or restore commands to the Snapshot Agent on target nodes.
- Workload Placement Optimizer: A future component that runs alongside the orchestrator. It automatically profiles workload execution patterns and configures time-sliceable job groups dynamically without manual user labeling.
3. Node-Scoped Layer (Hardware & Data Plane Isolation)
This bottom layer acts on the physical node boundary to enforce absolute memory isolation between oversubscribed pods:
- Snapshot Agent DaemonSet: A privileged daemon running on every accelerator node, exposing a gRPC interface that handles snapshot and restore calls from the Orchestrator or directly from an RL service. It performs accelerator state saves and restores.
- Pluggable Save Backend: A modular interface that translates agent commands into host process manipulation. The v1 implementation uses a
cuda-checkpointbinary and NVML cgroup tracking to discover compute processes, freeze execution, and serialize the entire active CUDA context directly to host DRAM. - Physical Accelerator Hardware Pool: The underlying physical GPU/TPU cluster infrastructure where oversubscribed execution steps alternate seamlessly without OOM risks or framework-level interference.
End-to-End Control and Data Flow for Time-Slicing
- The user's RL training loop reaches a natural pause point—such as the end of a rollout generation phase or a training step, a logical boundary where it is safe to give up the physical accelerator. At this boundary, the job invokes the TimeSlice client library to request hardware access for its next operational phase.
- The client library dispatches an Acquire RPC to the Accelerator Orchestrator, explicitly identifying the active
job_idand the targeted group of hardware nodes it requires. This remote procedure call synchronously blocks, forcing the workload thread to wait until the platform layer determines it is safe to proceed. - If another independent RL job currently holds the execution lock on the designated accelerator pool, the Accelerator Orchestrator places the incoming request into a First-In, First-Out (FIFO) queue assigned to that node group, preserving the strict order of request arrival.
- When the active job finishes and yields control, the orchestrator begins a coordinated swap. It communicates with the node-local Snapshot Agent to trigger a memory snapshot of the yielding job's active accelerator state, serializing its entire live CUDA context and moving the data off the physical accelerator into host DRAM.
- With the physical accelerator hardware now successfully evacuated and free of memory residency, the orchestrator evaluates the queue state, pops the next pending job from the front of the FIFO line, and initiates the control transfer.
- The orchestrator coordinates with the destination node's Snapshot Agent a second time, executing a restore operation. The agent deserializes the incoming job's cached state, lifting its model weights and execution context out of host DRAM and streaming them back onto the accelerator's high-bandwidth memory (VRAM).
- Once the physical memory restore completes successfully, the orchestrator grants the execution lock to the new job and returns a success status to the blocked Acquire call. The worker process immediately unblocks and resumes execution exactly where it left off, requiring zero rewrites or modifications to its core modeling logic.
- The job that previously yielded its compute window now sits warm in host memory. Its process state remains active, completely bypassing container cold-start overhead and standing ready to be re-streamed onto the accelerators just as efficiently when its turn comes back around in the scheduling queue.
Early Benchmarks
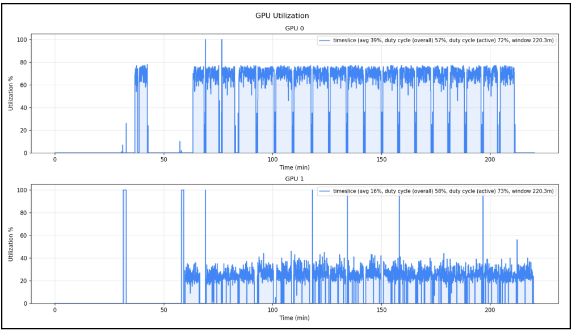
To validate the infrastructure’s ability to reclaim stranded compute capacity without impacting algorithmic convergence, early tests evaluated the platform-native time-slicing system using a representative Reinforcement Learning (RL) workload:
- Hardware Configuration: 1x NVIDIA H100 SXM5 (80GB) node (8 GPUs per node), interconnected via NVLink and InfiniBand networking.
- Model & Workload Configuration: Qwen2.5-7B-Instruct fine-tuned using veRL with GRPO (Group Relative Policy Optimization). Each job ran with a rollout batch size of 512, maximum prompt length of 1024 tokens, and maximum response length of 1024 tokens. Samplers ran via vLLM with tensor parallelism of 4, while trainers utilized PyTorch FSDP (Fully Sharded Data Parallel).
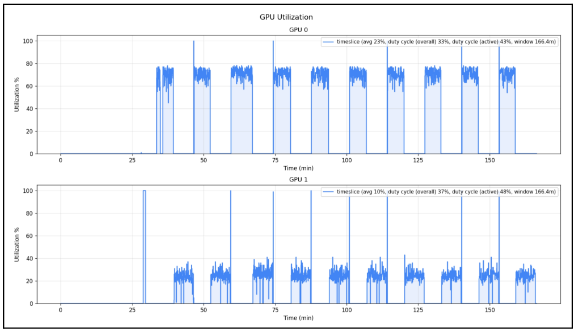
- Baseline Measurement Method: The 40% baseline GPU duty cycle was measured during standard standalone (non-interleaved) execution over 5 continuous training epochs using NVIDIA DCGM (Data Center GPU Manager) and Prometheus metrics. During standalone execution, GPUs remain completely idle (0% compute utilization) during reward computation on CPU, rollout buffer processing, and inter-node weight synchronization.
During the test, co-scheduling and interleaving two independent sampler workloads on a single node elevated the actual hardware duty cycle from a baseline of 40% to 70%, with a possible theoretical peak of ~95% under idealized phase alignments. The theoretical peak of ~95% is derived under complementary phase alignment where Job A is executing CPU-bound reward evaluation or weight transfer while Job B executes GPU-bound sampling or gradient computation; the remaining ~5% accounts for irreducible PCIe Gen5 host-to-device memory snapshot and restore serialization overheads. Because the active job maintains exclusive access to the GPU during its compute window, there is zero degradation to token generation or training step throughput.
Limitations and Workload Caveats
While Co-operative Time-Slicing significantly improves hardware utilization for alternating RL workflows, several real-world factors can influence net efficiency gains:
- Phase Alignment Dependencies: Achieving peak efficiency (>90%) relies on complementary phase timing between interleaved jobs. If two co-scheduled jobs request GPU compute simultaneously, one job must wait in the FIFO queue, which can introduce queuing tail latency. Future releases will address this via the intelligent Workload Placement Optimizer.
- Host DRAM & PCIe Bandwidth: Evacuating a multi-gigabyte CUDA context to host memory requires sufficient available host DRAM per node to cache inactive job states. Additionally, context switch times are bounded by PCIe transfer bandwidth between GPU VRAM and system memory; workloads with massive static memory footprints will experience slightly higher transition overheads.
- Co-operative Signaling Requirement: The current architecture relies on cooperative scheduling where jobs explicitly invoke
acquire()andyield()at natural phase boundaries. Ill-behaved workloads that fail to yield control cannot be preempted without aborting the active CUDA process.
Simple Developer Experience (Client-Side)
Researchers should be able to focus on core modeling logic rather than wrestling with low-level CUDA context switching or custom scheduling loops. In llm-d, RL job multiplexing can be enabled by wrapping the accelerator phases in existing loops with a simple Python decorator:
from timeslice import TimeSliceOrchestratorClient

orchestrator = TimeSliceOrchestratorClient(target="orchestrator:50051")

@orchestrator.on_accelerators(group_id="trainer-group")
def train_phase(model, trajectories):
    return model.update(trajectories)

@orchestrator.on_accelerators(group_id="sampler-group")
def generate_phase(model, prompts):
    return model.generate(prompts)

# Standard sequential loop — interleaved with other jobs under the hood
for epoch in range(EPOCHS):
    trajectories = generate_phase(policy, dataset)
    rewards = compute_rewards(trajectories)
    train_phase(policy, rewards)
Current Release and Future Outlook
Today, llm-d releases the Snapshot Agent along with an Integration Guide for integrating it into managed multi-tenant RL services to support full fine-tuning. Additionally, there is a new Slime Integration Guide demonstrating how time-slicing can help optimize RL jobs built with the Slime framework
Here's what comes next:
- Expanding the Snapshot Agent: Upcoming backends will enable ultra-fast snapshots and selective checkpointing that saves only specific memory regions such as LoRA adapter weights. Together, these unlock faster context switches for full fine-tuning workloads and open up new use cases such as multi-tenant RL services that time-slice between tenants by swapping only adapter state.
- Accelerator Orchestrator and Timeslice Client: The Orchestrator coordinates time-slicing across multiple jobs, managing cooperative lock queues and driving context switches at phase boundaries. Alongside it, a lightweight client library will allow any RL application to integrate using a two-call API:
acquire()before the accelerator phase andyield()after. - Framework Integrations: Future well-lit paths will integrate with slime, veRL, and other popular RL training frameworks, making it easy for researchers to adopt time-slicing without leaving their existing training stack.
- Simplified Onboarding and Intelligent Job Placement: Ongoing work will simplify platform deployment and introduce a component that automatically identifies time-sliceable workloads and makes intelligent job placement decisions, eliminating the need for users to manually identify and group compatible workloads.
- Expanding Accelerator Support: In line with llm-d's hardware-agnostic mission, the platform is designed to span multiple accelerator architectures, starting with GPUs and expanding to TPUs and beyond.
Help Shape the Future of SIG-RL
Building robust, highly optimized RL infrastructure requires tight collaboration with the engineers and researchers running these workloads at scale.
If you are currently wrestling with low GPU utilization, synchronization stalls, or complex scheduling logic in your post-training pipelines, the community welcomes your feedback and contributions:
- Use Time-Slicing for your RL jobs: Try out the reference implementations in the time-slicing repository.
- Explore the Code: Visit the repositories under the llm-d GitHub organization.
- Join the Discussion: Join the
#sig-rlchannel in the llm-d Slack. - Contribute: Share your reference implementations, benchmarks, and edge cases to help refine this well-lit path.